Technical Guide | Spectral Energy Distribution Module
Another crucial step to building mock galaxies is to model their stellar emission, which further enables the translation of theoretical quantities into mock observables. The light emitted by a galaxy is the direct outcome of the formation and evolution of stars, which are regulated by all the physical mechanisms involved in galaxy formation. From a practical point of view, modelling galaxy emission can be separated from the rest of the galaxy formation model. In TAO, this is performed as a postprocessing step in the spectral energy distribution module and applied to the TAO galaxy data. This postprocessing link uses the prediction for the star formation rate and metallicity of each galaxy at each time step to synthesis galaxy spectral energy distributions at the required time in the galaxy history.
Keeping all records of all star formation episodes for every galaxy can increase the simulation output size significantly. However, thanks to the relational design of the TAO database we can efficiently trace each galaxy's history among its progenitors using a system of FoF indexes (see Springel et al. 2005). Some existing publicly available models offer galaxy luminosities calculated at each simulation time step as the model is run, which are then interpolated according to the final position in the light-cone (e.g. Blaizot et al. 2005). Others offer a more sophisticated interpolation with k-corrections included (e.g. Merson et al. 2013). TAO, in contrast, calculates a more accurate galaxy luminosity directly from spectra constructed ‘on-the-fly’ in postprocessing, using each star formation history starting from the actual galaxy position in the light cone. This approach also has the advantage of allowing different stellar population synthesis models to be tested with existing galaxy data long after the model was originally run.
Stellar population synthesis models
Galaxy light is the superposition of the emission of all the stars in the galaxy. A galaxy is composed of a series of single stellar populations (SSPs), i.e. ensembles of stars formed in single episodes with the same age and metallicity. The SSPs that compose a galaxy either originate in the galaxy itself through star formation or are accreted from satellite galaxies.
The emission of every SSP has to be modelled and added to the total galaxy light. Obviously, as the stars in the galaxy age their emission changes with time, and the model needs to take this time-dependence into account. The tools used to accomplish this are stellar population synthesis (SPS) models, which are libraries of spectra of single stellar populations built on a grid of ages and metallicities, assuming a particular initial mass function (IMF) (e.g. Bruzual & Charlot 2003; Maraston 2005; Conroy, Gunn & White 2009). In order to model the galaxy emission as a function of time, TAO keeps track of all the single stellar populations in the galaxy at every time-step in the galaxy model and then assigns them the corresponding emission based on their age and metallicity. This emission is then summed over all populations to obtain the total galaxy light, i.e. its spectral energy distribution (SED).
At this stage, the complicating contribution to the SED from dust extinction and emission must also be included (see below).
Galaxy star formation histories
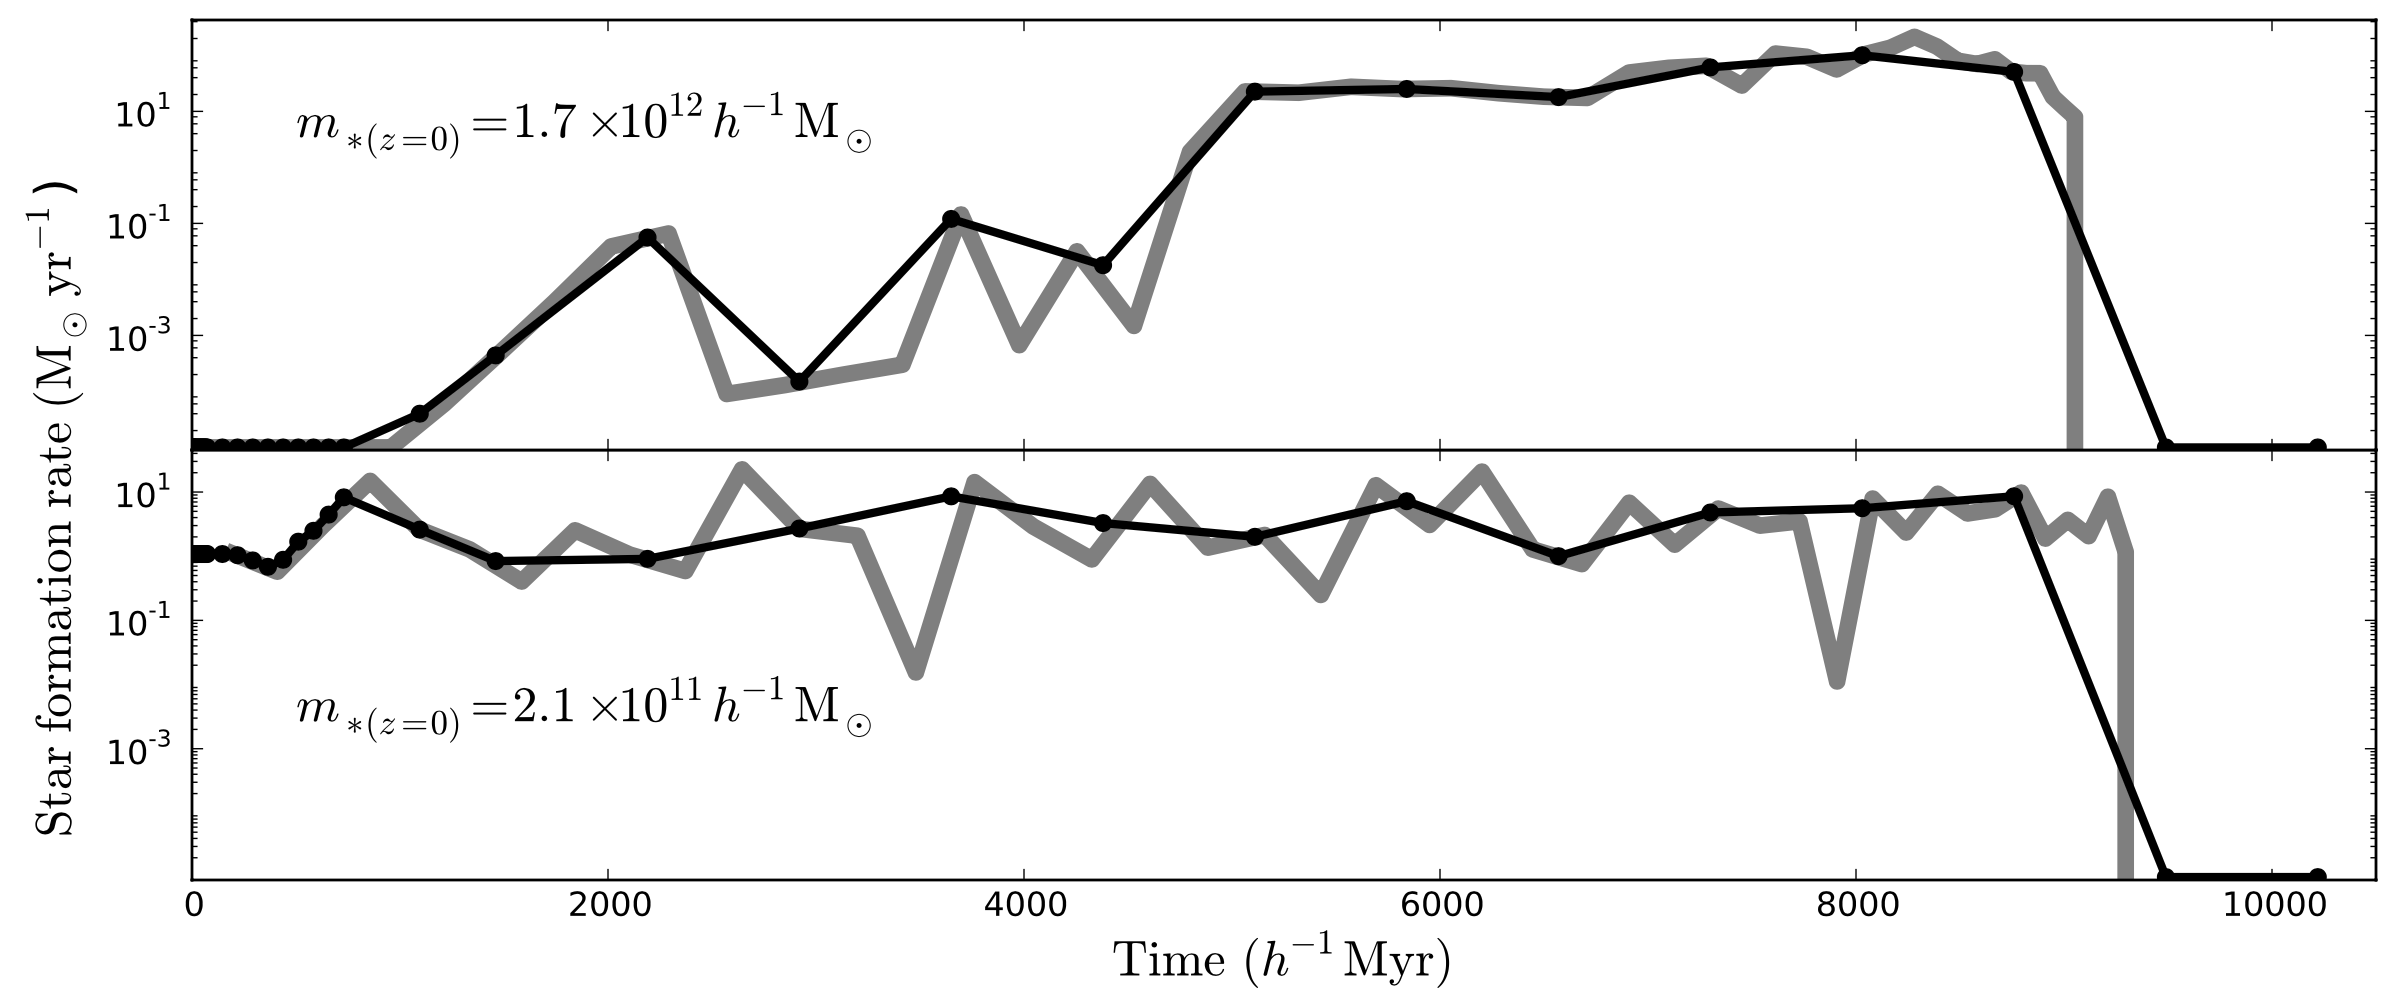
To calculate a galaxy's SED within TAO we require its star formation history, defined as the stellar populations present in the galaxy at the time of observation τ0, characterised by stellar mass, age, and metallicity. These populations include stars formed in the galaxy itself and those that have been accreted from satellites along the merger tree. We build a two-dimensional age and metallicity grid and collapse onto it the stars formed across the entire tree up to the point of observation (i.e. up to the point τ0, when we observe the galaxy on the light cone). Here, each bin represents a single stellar population of a given age and metallicity, and from the SPS libraries, we select the corresponding spectrum and weigh it by the stellar mass formed. Each of these spectra are then added to the total galaxy light to produce the final SED.
The challenge in the production of the star formation history is the grid itself. SPS models are built to follow the vastly different speeds of stellar evolution. For example, the emission of a young stellar population is dominated by massive stars and changes on time scales of ∼1 Myr while an old stellar population is dominated by less massive main-sequence stars and emits steadily on time scales of ∼1 Gyr. The star formation history grid needs to provide information on corresponding time scales in order to produce realistic galaxy SEDs. In particular, the ultra-violet and optical part of the SED is heavily (if not entirely) determined by young stellar populations with short lifetimes, an issue that becomes extremely important at high redshifts.
To this end, the star formation histories of every galaxy in the light cone must be written by TAO onto a time-varying grid, anchored at the time of observation τ0. The grid must be finely spaced (steps of 1 Myr) for young ages near τ0 and more sparsely spaced towards older ages. Unfortunately, the intrinsic semi-analytic model time grid (the snapshots on which the model calculates its physics) is not typically spaced like this. For example, the average time step of a model built using the Millennium Simulation is of the order of ∼ 300 Myr. Furthermore, refining a galaxy model grid to the level of precision required by SPS models is not usually practical due to the huge amount of data storage that would be required.
To make up for the loss of information on smaller timescales we spread the time-weighted stellar mass produced in each larger semi-analytic model output step onto the fine SPS time grid close to τ0. Note that this is equivalent to assuming that in each simulation time bin we have a constant star formation rate. At the other end of the SPS time grid the opposite is done, where the mass produced across multiple model time-steps are collected and rebinned to fill the coarser SPS grid, accounting for the slow evolution of the old stellar populations.
Galaxy spectro-photometric properties
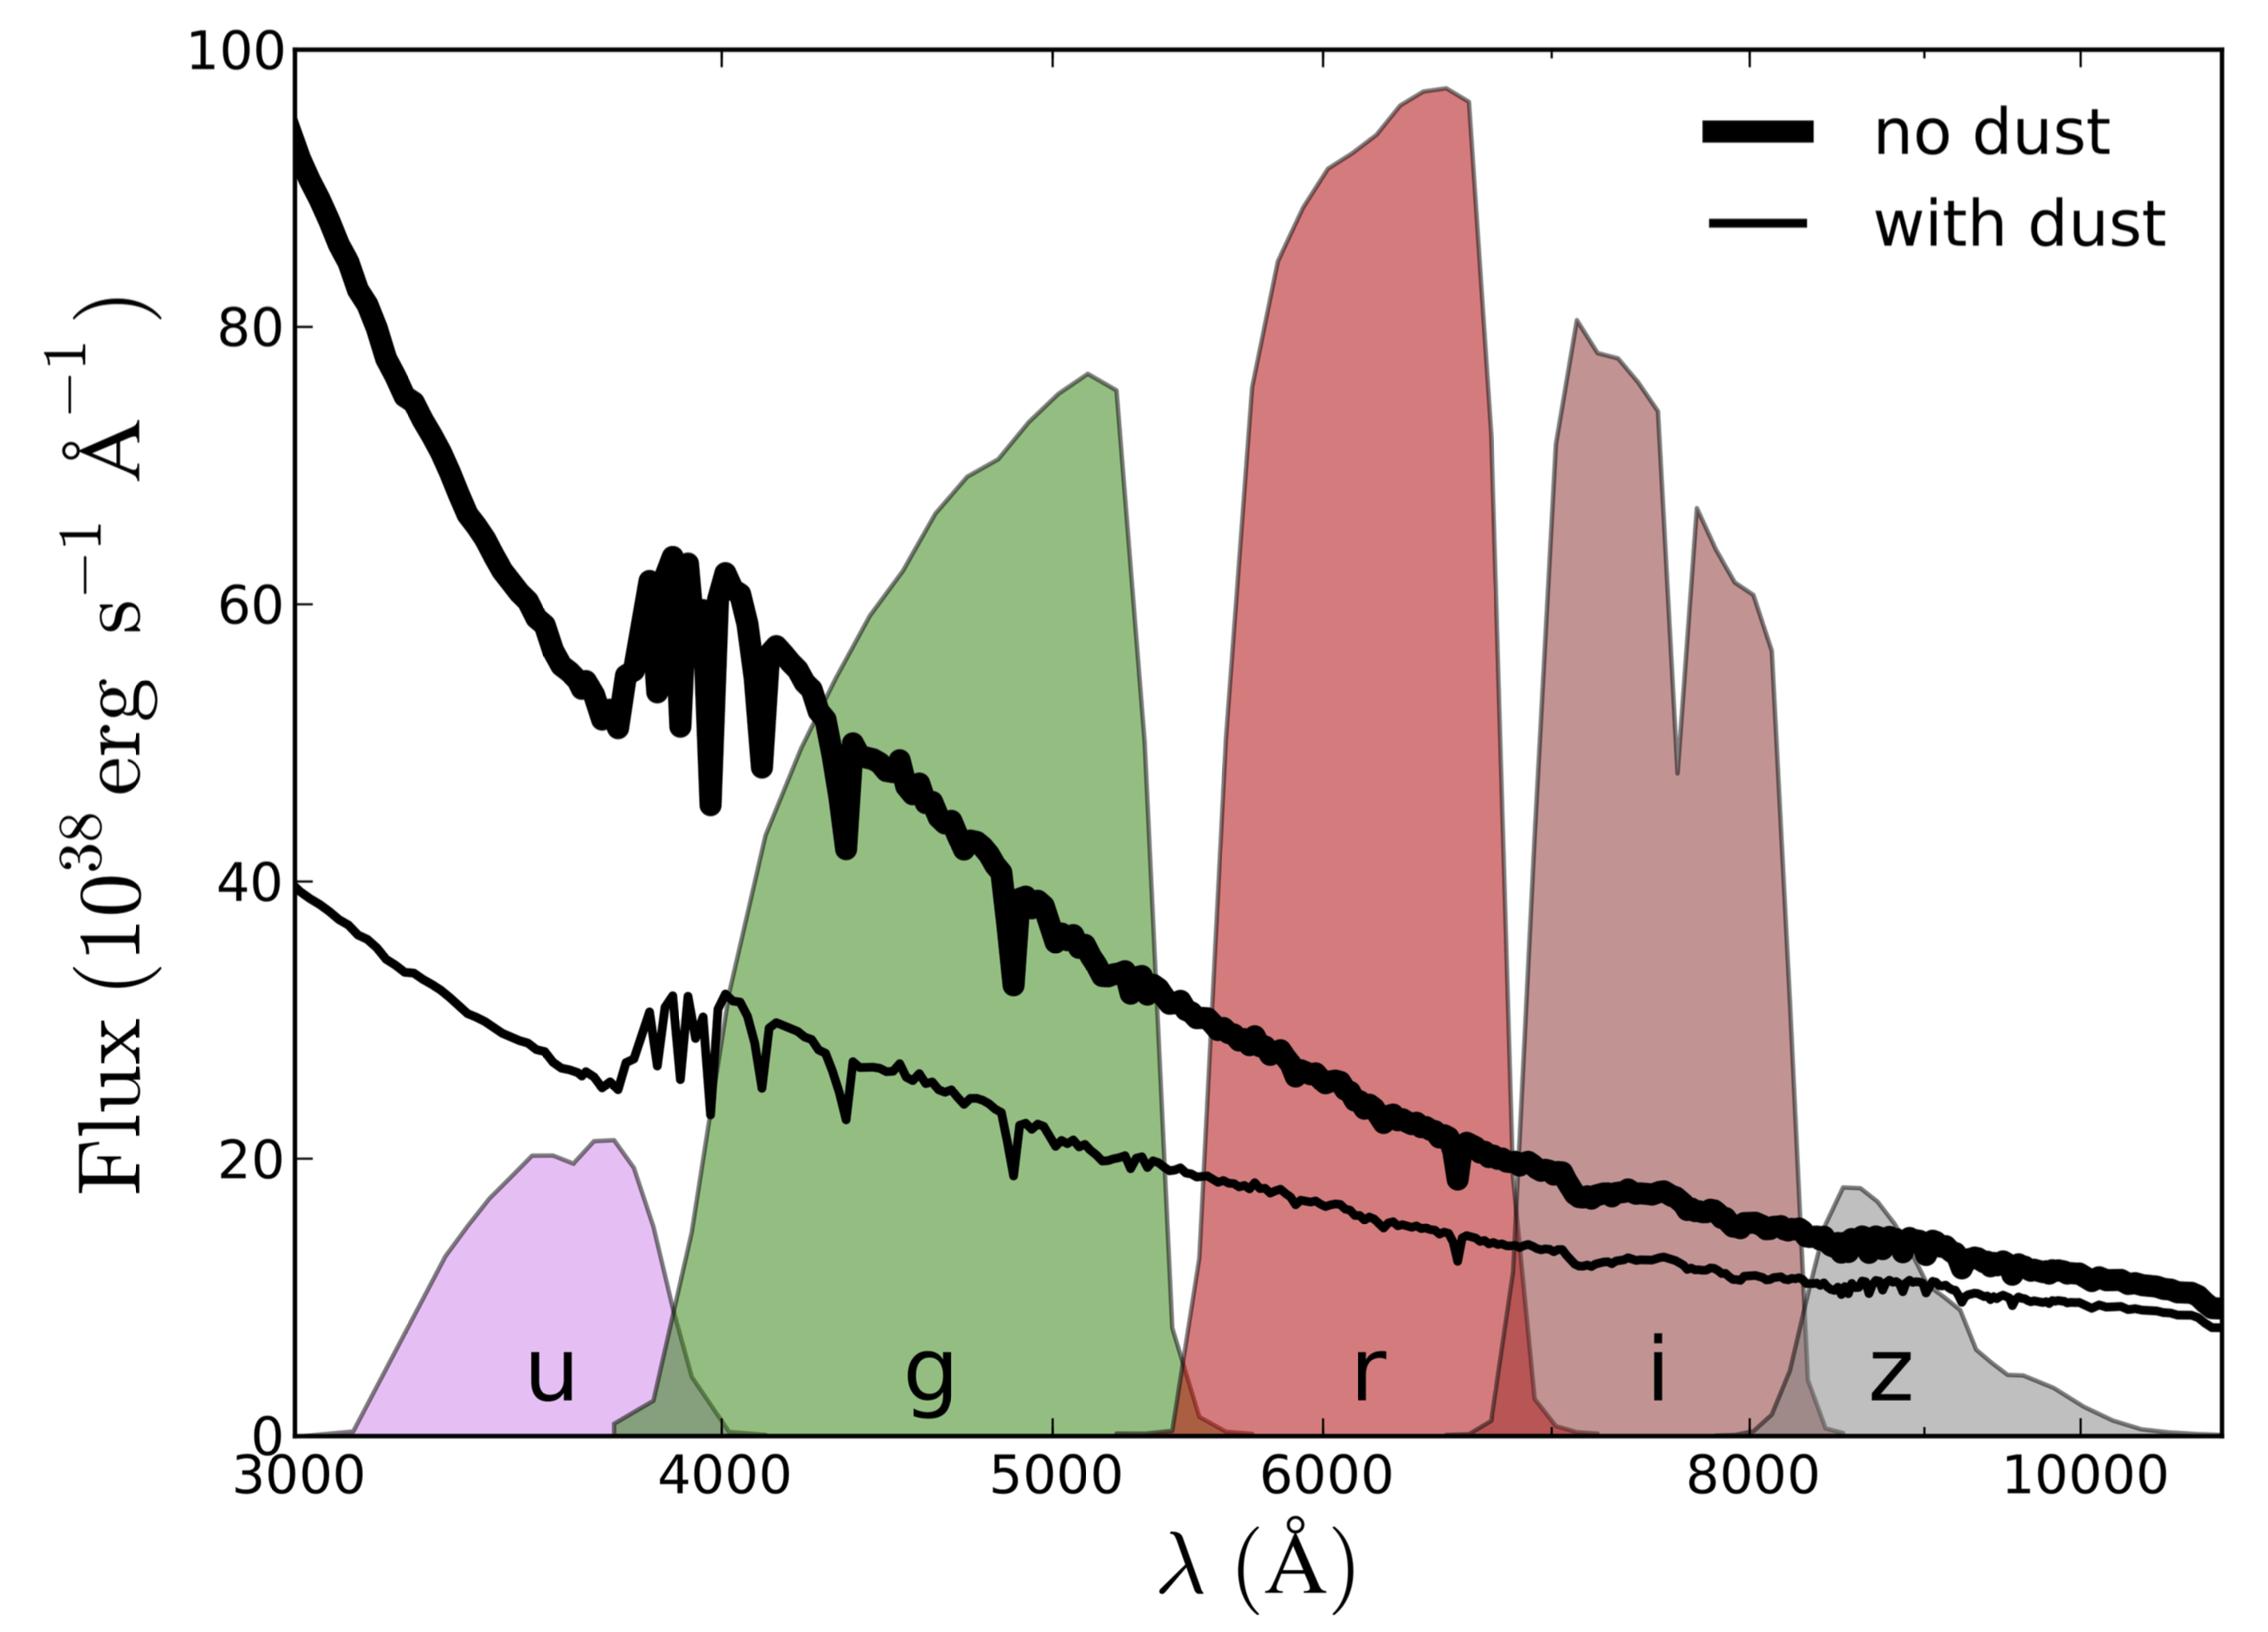
TAO produces galaxy photometry after determining the SEDs. Magnitudes are calculated by convolving each galaxy spectrum with a set of filter transmission functions, which include filters from many of the most commonly used instruments and surveys. TAO interpolates filters and spectra on a variable wavelength grid so that the resolution of the integration is constant no matter the wavelength extension of the filter function.
The user is given the choice of both absolute and apparent magnitudes for each filter. In the case of absolute magnitudes, fluxes are calculated from the total luminosity on a sphere of radius R = 10pc. For apparent magnitudes, the flux is calculated on a sphere of radius equal to the luminosity distance corresponding to the redshift of the galaxy. The spectrum is dimmed and stretched in wavelength according to the redshift, and then convolved with each selected filter function. Notice that this operation is exact, as opposed to the approximation of using a k-correction, as both the rest-frame and observed (stretched) spectra are known.
From the figure below, it is evident that recent and more intense star formation increases the stellar emission in the UV and optical wavelengths, and the young stellar populations dominate the bolometric luminosity. Also shown is the effect of including the contribution of dust extinction (in the UV/optical) and emission (mid-to-far infrared; thin line). The inclusion of dust in the theoretical spectra is available to the user as an option within the TAO SED science module (see below).
Dust
Dust emission and extinction play a fundamental role in shaping the galaxy SEDs, especially in cases of significant star formation, which is particularly relevant at high redshifts. In TAO, we provide dust modelling as a separate step and allow the user to choose whether to apply dust to the galaxy SED or not. Two popular models are available in TAO and are described below.
The slab model
In the slab model, stars and dust are assumed to be homogeneously distributed in an infinite plane-parallel slab with the same vertical scale. The galaxy spectra is then dust-attenuated before the magnitude is calculated, dependent on wavelength, disk inclination angle, and the intrinsic galaxy SED. See Section 5.4.1 of Bernyk et al. 2016 for more detail on this model.
The Calzetti prescription
The dust content of a galaxy can be parameterised with the colour excess E(B−V), which is defined as a renormalisation of the spectrum. Physically, dust content is associated with the presence of Type II supernovae, which are the main contributors to the metals that constitute the dust grains. Such grains are short-lived (with a life span of the order of ~10−100 Myr), so it is sensible to associate the dust content with the instantaneous star formation rate in the galaxy (see Tonini et al. 2011). TAO uses a Calzetti extinction curve, which produces absorption blue-wards of the Johnston K band, and re-emission red-wards (see Calzetti 1997 and Calzetti 2001). See Section 5.4.2 of Bernyk et al. 2016 for more detail on this model.
Advantages
Semi-analytic models are now taking advantage of such methods to generate galaxy light (Hatton et al. 2003; Tonini et al. 2009, 2010; Henriques et al. 2011; Merson et al. 2013), which add a level of sophistication and flexibility. The use of spectra, as opposed to magnitude tables (De Lucia, Kauffmann & White 2004; Croton et al. 2006; Baugh 2006; Bower et al. 2006) brings a number of advantages:
- increased precision due to the linear additive nature of luminosity vs the logarithmic behaviour of magnitudes;
- increased accuracy for the determination of observed magnitudes, which are obtained by integration on redshifted SEDs rather than through theoretical k-corrections that rely on toy-model spectra; and
- enormous flexibility, introduced when SEDs are modelled in post-processing.
Producing galaxy spectra allows us to separate the photometric calculations from the semi-analytic model itself, removing the need to rerun the galaxy model every time we want to change the photometry specifications. This can include different initial mass functions (IMF), dust models, filter sets, mock observational errors, and telescope or survey-specific effects.